

Ruby colored movie releases
Hey there !
The story
I recently had an heated debate with one of my friends around movies and their release dates. We were asking ourselves if there was a specific time in a year where good movies come out. Indeed, we often talk about the “summer blockbusters”, however this is often very unrelated to the quality of the film. I mean, both Fantastic Four movies were out in the summer…
There is decent amount of data over the internet related to “dump months”. These are the month in the year were there are lowered commercial and critical expectations for most new releases. Since less viewers go to theaters in January, February, August and September the movie industry shoves its bad flicks in these times. We should then expect movies in these periods to be averagely worse than other flagship months such as December.
On the other end of the scope, the end of the year usually gets a lot of praise from the film industry, this is commonly due to the cultural trend of going to the cinema around Christmas. Moreover, it should be noted that the later a movie is released, the higher chances are it will win an Oscar, I guess these eminent jury members have short memory, 54% of them are over the age of 60 after all !
All this existing data is very interesting, but heavily centered on the money output of movies, what about actual viewer enjoyment ?
Data used in this article was gathered from the top 1000 rated movies of Imdb. Imdb does not provide an API to this date to easily retrieve such information, the OMDb project helps for that matter but is incomplete. The data was then gathered directly from the IMDB website, the process is not described here.
The solution
The goal is to make a webpage including an animated visualization, here’s the final result.
Results
Before we dive into coding, let’s talk about some of the results.
Here are the 1000 highest ranked movies divided across release weeks. 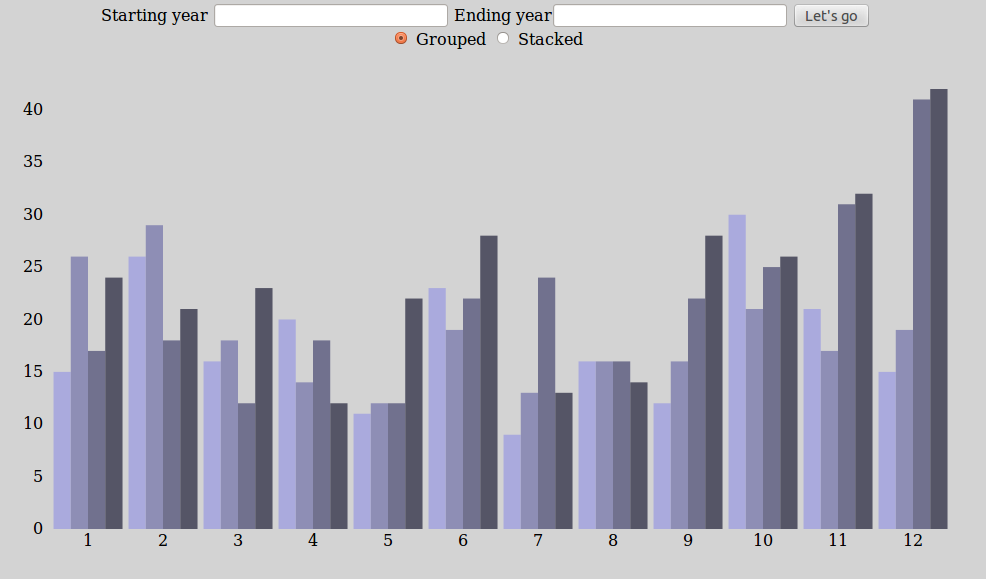
And across release months. 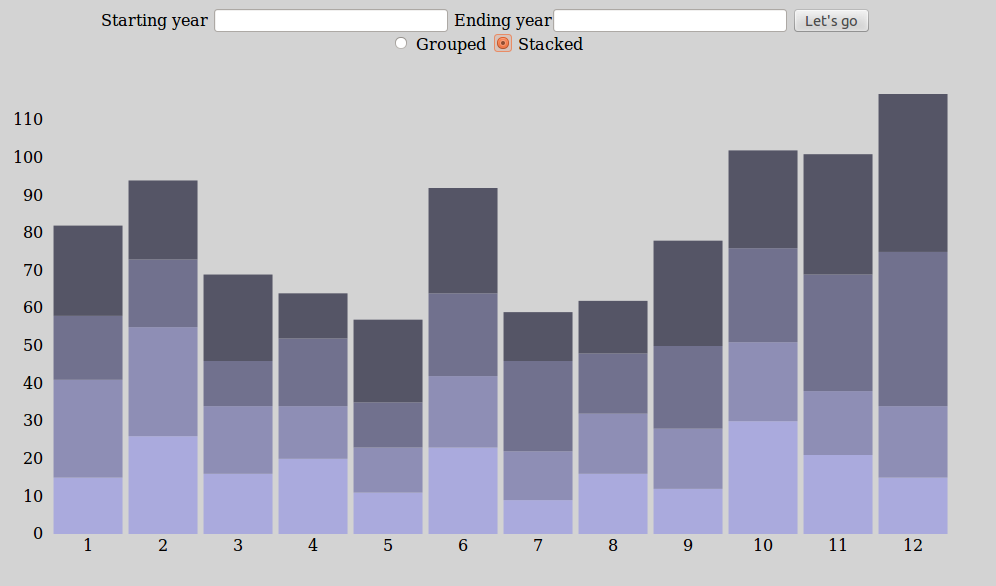
What I find very interesting in these graphs is that the “dump months” are clearly not shy of good movies, especially January, often labeled worst movie month. The uncontested leader stays December, thanks to the two last week of the year. However, it should be noted that movies expected to do well are out in that very specific time period. This statement is what makes January and February scores so interesting, movies out during these months are not expecting to win any awards or sell a lot of tickets by the movie industry, yet these “bad” movies tend to actually score high in user reviews, something must be flawed in the “dump months” theory.
Another interesting month is June where a lot of good movies tend to be released. This is a bit counter intuitive to me, since summer blockbusters are usually mediocre.
Well, it turns out that the mediocre summer blockbusters trend only started in the last few years, when the movie industry figured out that most of their budget should go on known faces and special effects, instead of scenario quality, in order to sell tickets. This new trend can be clearly seen when modifying the starting and ending years.
Movie distribution before 2000 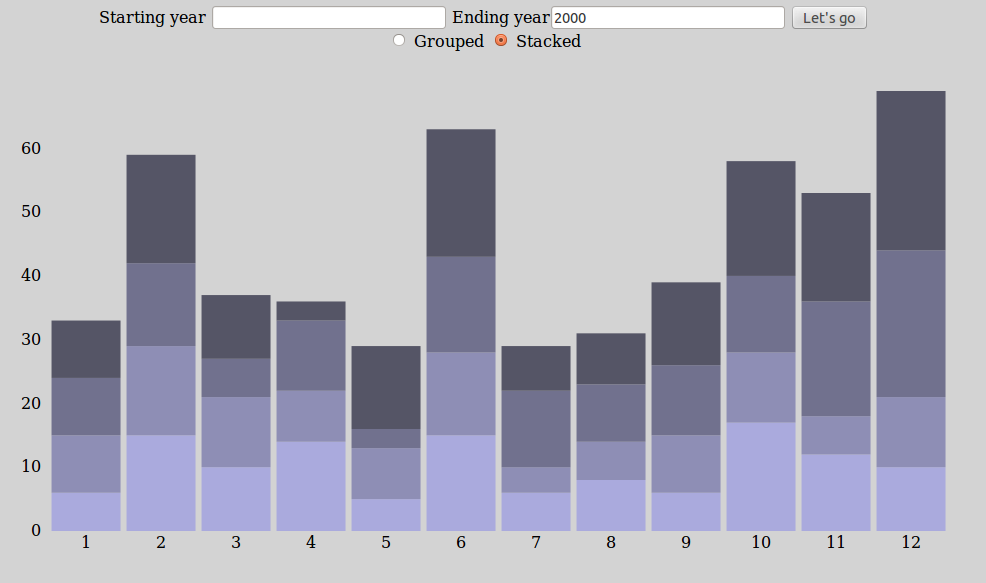
Movie distribution after 2000 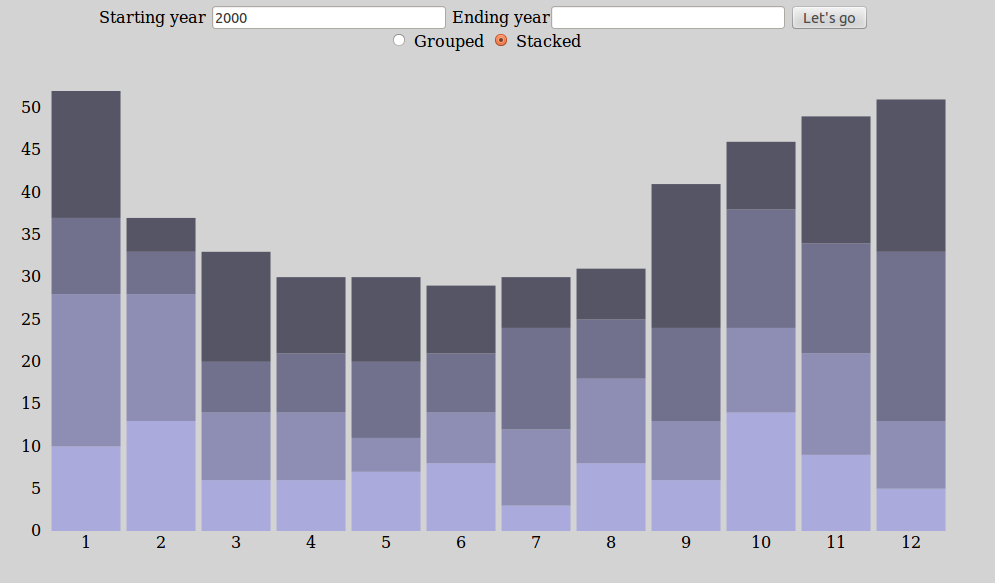
It’s quite clear how June dropped down in recent years, summer is not the same anymore.
Please play around with the data, I would gladly hear about what discoveries and analyses you can find !
Setting up the project
For this project to work, Ruby on Rails and MySQL should be present in your system.
MySQL configuration
Let’s create a films database.
mysql -u root -p
mysql> CREATE DATABASE films;
mysql> CREATE USER 'me'@'localhost' IDENTIFIED BY 'me';
mysql> USE films;
mysql> GRANT ALL ON films.* TO 'me'@'localhost';
mysql> quit
Rails app creation
Install mysql gem
sudo apt-get install libmysqlclient-dev
gem install mysql2
Create the rails app
rails new filmanalytics -d mysql
cd filmanalytics
emacs config/database.yml #edit default: password: line
rake db:create
rails server --binding=server_public_IP
Creating models
Since our database will be static and seeded, it is not necessary to fully describe the Film model, the app/models/film.rb file should however still be present.
#app/models/film.rb
class Film < ActiveRecord::Base
end
Creating controller
Rails should have already created an application_controller, we are going to add another controller in app/controllers/films_controller.rb. It will be in charge of accessing the database for us.
The controller, routes, and D3js overall integration to Ruby on Rails are heavily inspired by the Overfitted article on the subject, thanks Overfitted !
class FilmsController < ApplicationController
  private
  def fetch_week(first_date, last_date, startyear, endyear)
    if !startyear
      startyear = 0
    end
    if !endyear || endyear == ''
      endyear = 3000
    end
    return Film.where("Released >= ? and Released < ? and Year >= ? and Year <= ?", first_date, last_date, startyear, endyear).sort_by { |f| f.ImdbRating }.reverse
  end

  public
  def data
    puts params
    dates = Array.new(4)
    for k in 0..3
      dates[k] = Array.new(12)
    end
    for i in 1..12
      if i < 10
        weeks = [
                 "0" + i.to_s + "/01",
                 "0" + i.to_s + "/08",
                 "0" + i.to_s + "/15",
                 "0" + i.to_s + "/22",
                 "0" + i.to_s + "/31",
                ]
      else
        weeks = [
                 i.to_s + "/01",
                 i.to_s + "/08",
                 i.to_s + "/15",
                 i.to_s + "/22",
                 i.to_s + "/31",
                ]
      end
      for k in 0..3
        films = fetch_week(weeks[k], weeks[k + 1], params["startyear"], params["endyear"])
        dates[k][i-1]= {x:i, y: films.length, films: films}
      end
    end
    respond_to do |format|
      format.json {
        render :json => dates
      }
    end
  end
  def graph
  end
end
Routing
Once our controller is created, we need to create routes in config/routes.rb.
#config/routes.rb
Rails.application.routes.draw do
    resources :films
      get '/' => 'films#graph'
      get '/year/:startyear' => 'films#graph'
      get '/year/:startyear/:endyear' => 'films#graph'
      get '/data' => 'films#data'
end
View
Let’s create a page that the controller will use to display our graphs ! We create the template filed as app/views/films/graph.html.erb.
Warning, in Rails, filenames do really matter !
<label>Starting year <input type="text" id="startyear"></input></label>
<label>Ending year<input type="text" id="endyear"></input></label>
<button type="button" id="go">Let's go</button>
<form>
  <label><input type="radio" name="mode" value="grouped"> Grouped</label>
  <label><input type="radio" name="mode" value="stacked" checked> Stacked</label>
</form>
<div id="svgcontainer">
</div>
<div id="films">
</div>
D3js integration
In order to integrate D3 to our rails app, we first need to load the library. The d3.js file should be placed in vendor/assets/javascripts/d3.js.
app/assets/javascripts/application.js should contain the following lines.
//app/assets/javascripts/application.js
//= require jquery
//= require jquery_ujs
//= require turbolinks
//= require d3
//= require_tree .
Finally, we create a javascript file containing our D3js code and other JQuery magic as app/assets/javascripts/graph.js. The majority of this code is copied from the Stacke-to-Grouped Bars example from the creator of D3.js. The missing axis was added and dynamically updated.
// app/assets/javascripts/graph.js
// Read parameters and feed them to /data
var spl = document.location.pathname.split("/");
var url;
if (spl[1] === "year"){
    url = "/data?startyear=" + spl[2];
    if (spl.length > 2){
	url += "&endyear=" + spl[3];
    }
} else {
    url = "/data"
}
// Request data from db
$.ajax({
           type: "GET",
           contentType: "application/json; charset=utf-8",
           url: url,
           dataType: 'json',
           success: function (data) {
               draw(data);
           },
           error: function (result) {
               error();
           }
       });
// Create multiple dom elements containing films in film_array to be displayed
function display_films(film_array) {
    var i, film;
    // Remove anything that was here before
    $("#films").html("");
    for (i = 0; i < film_array.length; i = i + 1){
	film = film_array[i];
	$("#films").append("<div class='film' style='margin: auto; float:none;'>\
<div id='poster'>\
    <img src='"+ film.Poster +"'></img>\
    </div>\
    <div id='info'>\
    <div id='title'>\
      <a href='http://imdb.com/title/"+film.ImdbID+"'>"+ film.Title+"</a>\
    </div>\
    <div id='released'>\
     "+ film.Released+"\
    </div>\
    <div id='rating'>\
     "+ film.ImdbRating +"/10\
    </div>\
    <div class='names'>\
      "+film.Director+"\
    </div>\
    <div class='names'>\
     "+ film.Actors +"\
    </div>\
    \
    <div id='plot'>\
      "+ film.Plot +"\
    </div>\
    </div>");
    }
}
function draw(data) {
    var i = -1;
    function getdata(){
	i = i + 1;
	return data[i];
    }
    var n = 4, // number of layers
    m = 12, // number of samples per layer
    stack = d3.layout.stack(),
    layers = stack(d3.range(n).map(function() { return getdata(); })),
    yGroupMax = d3.max(layers, function(layer) { return d3.max(layer, function(d) { return d.y; }); }),
    yStackMax = d3.max(layers, function(layer) { return d3.max(layer, function(d) { return d.y0 + d.y; }); });
    var margin = {top: 40, right: 10, bottom: 20, left: 40},
    width = 960 - margin.left - margin.right,
    height = 500 - margin.top - margin.bottom;

    var x = d3.scale.ordinal()
	.domain(d3.range(1, m+1))
	.rangeRoundBands([0, width], .08);

    var y = d3.scale.linear()
	.domain([0, yStackMax])
	.range([height, 0]);

    var color = d3.scale.linear()
	.domain([0, n - 1])
	.range(["#aad", "#556"]);

    var xAxis = d3.svg.axis()
	.scale(x)
	.tickSize(0)
	.tickPadding(6)
	.orient("bottom");
   var yAxis = d3.svg.axis()
	.scale(y)
	.tickSize(0)
	.orient("left");

    // We select our specific container
    var svg = d3.select("#svgcontainer").append("svg")
	.attr("width", width + margin.left + margin.right)
	.attr("height", height + margin.top + margin.bottom)
	.append("g")
	.attr("transform", "translate(" + margin.left + "," + margin.top + ")");

    var layer = svg.selectAll(".layer")
	.data(layers)
	.enter().append("g")
	.attr("class", "layer")
	.style("fill", function(d, i) { return color(i); });

    var rect = layer.selectAll("rect")
	.data(function(d) { return d; })
	.enter().append("rect")
	.attr("x", function(d) { return x(d.x); })
	.attr("y", height)
	.attr("width", x.rangeBand())
	.attr("height", 0)
    //When clicking on a rect, we should display the films corresponding to the week
	.on("click", function(e) {
	    display_films(e.films)
	})

    svg.append("g")
	.attr("class", "x axis")
	.attr("transform", "translate(0," + height + ")")
	.call(xAxis);
    var yax = svg.append("g")
	.attr("class", "y axis")
	.attr("transform", "translate(0, 0)")
	.call(yAxis);

    d3.selectAll("input").on("change", change);

    var timeout = setTimeout(function() {
	d3.select("input[value=\"grouped\"]").property("checked", true).each(change);
    }, 2000);

    // Swap from grouped to stacked with inputs
    function change() {
	clearTimeout(timeout);
	if (this.value === "grouped") transitionGrouped();
	else transitionStacked();
    }

    function transitionGrouped() {
	y.domain([0, yGroupMax]);

	rect.transition()
	    .duration(500)
	    .delay(function(d, i) { return i * 10; })
	    .attr("x", function(d, i, j) { return x(d.x) + x.rangeBand() / n * j; })
	    .attr("width", x.rangeBand() / n)
	    .transition()
	    .attr("y", function(d) { return y(d.y); })
	    .attr("height", function(d) { return height - y(d.y); });
	// Let's also update the Axis
	yAxis = d3.svg.axis()
	    .scale(y)
	    .tickSize(0)
	    .orient("left");
	yax.call(yAxis);
    }

    function transitionStacked() {
	y.domain([0, yStackMax]);

	rect.transition()
	    .duration(500)
	    .delay(function(d, i) { return i * 10; })
	    .attr("y", function(d) { return y(d.y0 + d.y); })
	    .attr("height", function(d) { return y(d.y0) - y(d.y0 + d.y); })
	    .transition()
	    .attr("x", function(d) { return x(d.x); })
	    .attr("width", x.rangeBand());

	// Let's also update the Axis
	yAxis = d3.svg.axis()
	    .scale(y)
	    .tickSize(0)
	    .orient("left");
	yax.call(yAxis);
    }
}

function error() {
    console.log("error")
}

// Set the text input values to match the params
// When the button is clicked, redirect to the same page with different params
$(document).ready(function(){
    $("#startyear").val(spl[2]);
    $("#endyear").val(spl[3]);
    $('#go').click(function(e) {
        var startyear = $("#startyear").val();
        var endyear = $("#endyear").val();
        window.location.href ="/year/"+startyear+"/"+endyear;

    });
});
Seeding and starting
Now that every element is created, replace your db/seeds.rb file with the one from my github project, run
rake db:seed
And start the server !
rails server
There we go, I hope you have fun with it. I do acknowledge that using Ruby on Rails for such a front-end heavy application is probably not the smartest idea, especially since I barely use templates in this project. But eh, you know, it was fun to make. Comments and feedback are always welcomed !
The Code
https://github.com/TTalex/filmanalytics


Leave a Comment